A lot of people have discussed about how the Capitals will struggle in the new Metropolitan Division, being a borderline playoff team at best. Their arguments basically are derived from this:
Caps vs Southeast, last two seasons: 27-11-4 (a 113pt pace)
Caps vs Metro, last two seasons: 19-20-7 (an 80pt pace)
I have several issues with that reasoning.
First, just think about it: do you actually believe a team can play President's Trophy-caliber hockey against one division and be a lottery team against another? That's a huge difference.
07-08 was The Year The Biggest Baddest Division Sent Four Teams To The Playoffs.* Considering Carolina finished 9th—losing out on a playoff spot on the last day of the season—this could be the strongest-case scenario for the Metropolitan Division. The Southleast (lol) division, meanwhile, only sent one team to the dance—Washington—and had two teams in the lottery. (Tampa picked Steven Stamkos first overall; Zach Bogosian went third to then-Atlanta; Nikita Filatov went 6th to Columbus; the Islanders would have picked fifth, but traded down.)
*I think the Central has been stronger for a couple of years now, and the Pacific was very strong back around 2008, but it's hard to convince people. To me, they're just like the fans of Western Conference teams who think the Eastern Conference is a cupcake.
The key numbers to note here are in the last two rows, listing the average number of points gained by opponents of teams in each grouping. There's a 10-point difference between the Metropolitan and Southeast averages in both 2007-08 and 2013 (which rates to a 16-point difference per 82 games). Since the variance in the NHL standings due to randomness is much bigger in a 48-game season than in a full season, I think it's fair to assume that had we seen 82 games, that 16-point gap would have narrowed slightly—maybe to 12 or 13.
Is that significant? Absolutely. But look back up at the basis of our friends' arguments: the difference for the Capitals in terms of actual performance is 33 points. Ten points is less than a third of that. If the Big Bad Metro is truly that strong, its overall strength of schedule will be weak, meaning a below average team could accumulate 89 points in a season playing only the seven other Metro teams. If the Capitals are merely average, playing only the other seven Metro teams, they'd be on the playoff bubble; throw in games against the rest of the below-average league—oh, and Mikhail Grabovski, who should be worth a few points in the standings on his own—and that's a solid playoff team.
The other question is ask here is whether the Capitals match up extraordinarily well with the other SE teams and very poorly against the Big Bad Atlantic. I don't think that's the case.
For one, I think transitivity usually applies in hockey. If Team A is better than Team B, and Team B is better than Team C, then head-to-head, Team A should be able to beat Team C. Matchups I feel are significant only at the margins. The Capitals played the NE—a division with at least two, maybe three teams as good as the Atlantic's best, plus another which made the playoffs as well—at a 93-point pace in 2013. They played the Northeast at a 115-point pace in 2012, when the division had one great team, one good team, one mediocre team, and two bad teams. Combined, that's a 101-point pace.
So Team X plays one division at a 113-point pace. It plays a second at a 101-point pace. It plays the third at an 80-point pace. The third plays the second at a 96-point pace, suggesting that it's slightly better than the second and that Team X could be above average in Division III. So tell me, how hard do you think that third division actually is?
Second, I put together some charts to see if there's any patterns in differences between a team's points pace versus a certain division and outside that division. On the X-axis is the difference in points-per-game in Year 1, and on the Y-axis is the same metric in Year 2. I excluded Eastern Conference teams when Year 1 = 2011 and the division in question was the Central, Pacific, or Northwest (as well as the analogous case for Western Conference teams), since there was no inter-conference play in the appropriate Year 2 (aside from the Stanley Cup Final).

What can we see here? Given the small number of dots, this becomes a Rorschach test. I'd just like to point out a few things:
 I added the charts for individual divisions at the bottom. It looks to me like the Southeast is shifted slightly up and to the right—so teams can consistently perform better against the Southeast than outside it—and the Northeast, Central, and Atlantic are shifted slightly to the left. Slightly.
Oh, and before I forget, there's one more thing I need to mention:
The Capitals' extra games against the Metropolitan division are actually against Columbus. I think the Blue Jackets are the worst team in the division. (I'm not high on Nathan Horton, who'll be out until December anyway, and given even odds, I'd bet against Sergei Bobrovsky posting a .930—or even a .920—next season. That'll cost the BJs something like 20 goals in goal differential.)
I have to believe that the difference we've observed for the Capitals over the past two seasons is far less significant than it's sometimes assumed. We'd like to believe that the records teams have are truly indicative of team quality, but they're not—they're just a sampling of that quality. We expect the record to be reflective of a team's true quality in the long run, but here are 30 teams in this league, so thanks to randomness, some are bound to have better or worse records than their "true quality." Especially when we're talking about just 30 games—less than half the amount needed for skill to become more important than luck in the standings.
The Caps' bad games in 2013 just happened to be against future Metro teams, and their better games—for you people who find it admirable to have momentum going into the playoffs—were division games heading into the playoffs.
(It's probably also worth noting that after coaching changes, we expect an adjustment period, and the Caps have had two of those in the last two years. The adjustment periods came largely before the run into the playoffs, when most of the non-divisional games happen.)
The schedule does change things. Relative to 2011-12, the Capitals lost three games against each of Florida and Tampa Bay, plus four against Winnipeg. They also lost a game against each team in the Northeast division—considering how strong that division has become over the last two years, that's a good thing. They added two or three games against Detroit, which will be tough, and added one or two games against each team in the Western Conference, which isn't as strong as it has been in the past.* Want to replace ten cupcake Southeast games? Try Calgary x 2, Colorado x 2, Nashville x 2, and Columbus x 3. That's nine out of ten, and one remaining game doesn't change the status of a team from "solid playoff team" to "bubble."
*Nashville, Phoenix, Dallas, Colorado, Calgary, Winnipeg, Edmonton, and Anaheim look like below-average teams to me, and the only elite teams are Los Angeles and Chicago. I think there are five such teams out East now—Pittsburgh, Montreal, Boston, Ottawa, and Detroit—with only Tampa Bay, Florida, Buffalo, Toronto, and Columbus being solidly below average.
Look, the bottom line is this: the Capitals are not as bad a team as they looked for the first ~15 games last season. Their results won't be as good as they got in the final 20 games of last season, either. But replacing Ribeiro with Grabovski is an upgrade. Getting Erat and Laich for full seasons is an upgrade. Getting an older, more mature John Carlson, Karl Alzner, Braden Holtby, and Marcus Johansson is an upgrade.
The Capitals were an ~even possession team for the last half of the season. Without their 2C (Ribeiro) on the ice, they were basically even as well, and over that final stretch, they were in the black. With Grabovski and Erat in the mix, they should be a positive possession team—or, at least, nonnegative—all the time. Throw in above-average netminding, shot quality/finishing ability (it may not be significant, but it's there), and average special teams (good power play, poor penalty kill), and this is a playoff team.
I don't think Washington is a lock, like Pittsburgh, Detroit, Ottawa, Montreal, and Boston—it's always possible the team hits some major injury issues or really bad luck, or there's some sort of chemistry disaster with Erat and Grabovski trending Nylander, and I don't think their margin of error is big enough to keep them in the playoff picture in those cases—but among the rest of the teams vying for those final three playoff spots, the Capitals, on paper, look as good as anyone. Sure, the "anyone" includes all the bubble teams, but the Capitals were a bubble team in 2012 and 2013, too.
The move to the Metro, at worst, doesn't really change anything.
Charts from above:


Caps vs Southeast, last two seasons: 27-11-4 (a 113pt pace)
Caps vs Metro, last two seasons: 19-20-7 (an 80pt pace)
I have several issues with that reasoning.
First, just think about it: do you actually believe a team can play President's Trophy-caliber hockey against one division and be a lottery team against another? That's a huge difference.
2007-2008
|
2013
|
||
Team
|
Opp pts gained
|
Opp pts gained
|
Per 82
|
Pittsburgh
|
78
|
29
|
50
|
Philadelphia
|
85
|
53
|
91
|
New York Rangers
|
90
|
50
|
85
|
New York Islanders
|
104
|
54
|
92
|
New Jersey
|
86
|
61
|
104
|
Carolina
|
85
|
60
|
103
|
Columbus
|
101
|
59
|
101
|
Atlanta/Winnipeg
|
111
|
54
|
92
|
Florida
|
97
|
70
|
120
|
Tampa Bay
|
106
|
62
|
106
|
Metro Avg
|
90
|
52
|
89
|
Southeast Avg
|
100
|
62
|
105
|
07-08 was The Year The Biggest Baddest Division Sent Four Teams To The Playoffs.* Considering Carolina finished 9th—losing out on a playoff spot on the last day of the season—this could be the strongest-case scenario for the Metropolitan Division. The Southleast (lol) division, meanwhile, only sent one team to the dance—Washington—and had two teams in the lottery. (Tampa picked Steven Stamkos first overall; Zach Bogosian went third to then-Atlanta; Nikita Filatov went 6th to Columbus; the Islanders would have picked fifth, but traded down.)
*I think the Central has been stronger for a couple of years now, and the Pacific was very strong back around 2008, but it's hard to convince people. To me, they're just like the fans of Western Conference teams who think the Eastern Conference is a cupcake.
The key numbers to note here are in the last two rows, listing the average number of points gained by opponents of teams in each grouping. There's a 10-point difference between the Metropolitan and Southeast averages in both 2007-08 and 2013 (which rates to a 16-point difference per 82 games). Since the variance in the NHL standings due to randomness is much bigger in a 48-game season than in a full season, I think it's fair to assume that had we seen 82 games, that 16-point gap would have narrowed slightly—maybe to 12 or 13.
Is that significant? Absolutely. But look back up at the basis of our friends' arguments: the difference for the Capitals in terms of actual performance is 33 points. Ten points is less than a third of that. If the Big Bad Metro is truly that strong, its overall strength of schedule will be weak, meaning a below average team could accumulate 89 points in a season playing only the seven other Metro teams. If the Capitals are merely average, playing only the other seven Metro teams, they'd be on the playoff bubble; throw in games against the rest of the below-average league—oh, and Mikhail Grabovski, who should be worth a few points in the standings on his own—and that's a solid playoff team.
The other question is ask here is whether the Capitals match up extraordinarily well with the other SE teams and very poorly against the Big Bad Atlantic. I don't think that's the case.
For one, I think transitivity usually applies in hockey. If Team A is better than Team B, and Team B is better than Team C, then head-to-head, Team A should be able to beat Team C. Matchups I feel are significant only at the margins. The Capitals played the NE—a division with at least two, maybe three teams as good as the Atlantic's best, plus another which made the playoffs as well—at a 93-point pace in 2013. They played the Northeast at a 115-point pace in 2012, when the division had one great team, one good team, one mediocre team, and two bad teams. Combined, that's a 101-point pace.
So Team X plays one division at a 113-point pace. It plays a second at a 101-point pace. It plays the third at an 80-point pace. The third plays the second at a 96-point pace, suggesting that it's slightly better than the second and that Team X could be above average in Division III. So tell me, how hard do you think that third division actually is?
Second, I put together some charts to see if there's any patterns in differences between a team's points pace versus a certain division and outside that division. On the X-axis is the difference in points-per-game in Year 1, and on the Y-axis is the same metric in Year 2. I excluded Eastern Conference teams when Year 1 = 2011 and the division in question was the Central, Pacific, or Northwest (as well as the analogous case for Western Conference teams), since there was no inter-conference play in the appropriate Year 2 (aside from the Stanley Cup Final).
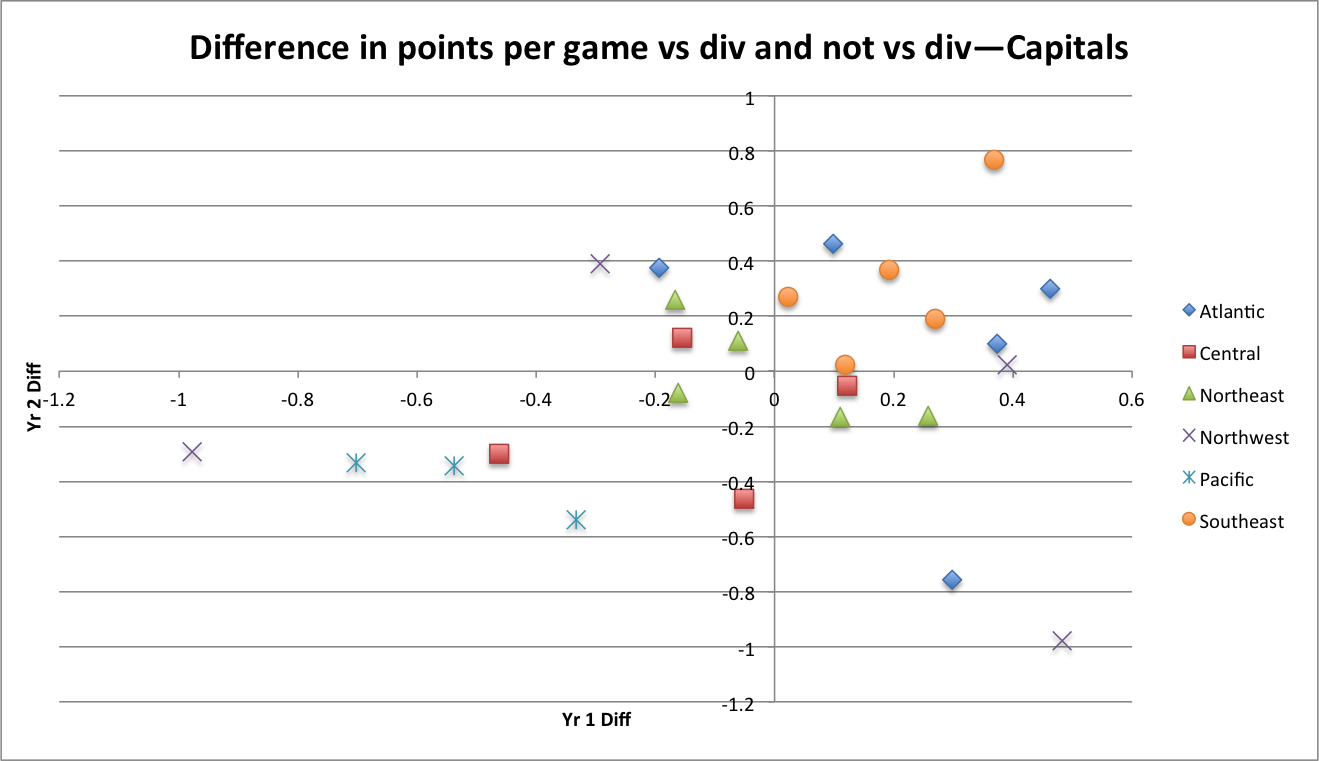
What can we see here? Given the small number of dots, this becomes a Rorschach test. I'd just like to point out a few things:
- The Capitals versus the Atlantic have not performed below their outside-Atlantic points per game average in consecutive seasons. They were underwater in 2013.
- To Caps fans, all the dots in the bottom left quadrant for the Pacific are no surprise.
- The Northeast dots are clustered around the middle.
- Also unsurprising—the Capitals have performed better against the Southeast than they do outside it every season.

Oh, and before I forget, there's one more thing I need to mention:
Games faced
|
||||
Team
|
2011-12
|
2013
|
Per 82
|
2013-14
|
Pittsburgh
|
4
|
3
|
5
|
4
|
Philadelphia
|
4
|
3
|
5
|
4
|
NY Rangers
|
4
|
3
|
5
|
4
|
NY Islanders
|
4
|
3
|
5
|
4
|
New Jersey
|
4
|
3
|
5
|
4
|
Carolina
|
6
|
5
|
9
|
5
|
Columbus
|
1
|
0
|
0
|
4
|
Winnipeg
|
6
|
5
|
9
|
2
|
Florida
|
6
|
4
|
7
|
3
|
Tampa Bay
|
6
|
4
|
7
|
3
|
Metro total
|
27
|
20
|
34
|
29
|
Southeast total
|
24
|
18
|
31
|
13
|
The Capitals' extra games against the Metropolitan division are actually against Columbus. I think the Blue Jackets are the worst team in the division. (I'm not high on Nathan Horton, who'll be out until December anyway, and given even odds, I'd bet against Sergei Bobrovsky posting a .930—or even a .920—next season. That'll cost the BJs something like 20 goals in goal differential.)
I have to believe that the difference we've observed for the Capitals over the past two seasons is far less significant than it's sometimes assumed. We'd like to believe that the records teams have are truly indicative of team quality, but they're not—they're just a sampling of that quality. We expect the record to be reflective of a team's true quality in the long run, but here are 30 teams in this league, so thanks to randomness, some are bound to have better or worse records than their "true quality." Especially when we're talking about just 30 games—less than half the amount needed for skill to become more important than luck in the standings.
The Caps' bad games in 2013 just happened to be against future Metro teams, and their better games—for you people who find it admirable to have momentum going into the playoffs—were division games heading into the playoffs.
(It's probably also worth noting that after coaching changes, we expect an adjustment period, and the Caps have had two of those in the last two years. The adjustment periods came largely before the run into the playoffs, when most of the non-divisional games happen.)
The schedule does change things. Relative to 2011-12, the Capitals lost three games against each of Florida and Tampa Bay, plus four against Winnipeg. They also lost a game against each team in the Northeast division—considering how strong that division has become over the last two years, that's a good thing. They added two or three games against Detroit, which will be tough, and added one or two games against each team in the Western Conference, which isn't as strong as it has been in the past.* Want to replace ten cupcake Southeast games? Try Calgary x 2, Colorado x 2, Nashville x 2, and Columbus x 3. That's nine out of ten, and one remaining game doesn't change the status of a team from "solid playoff team" to "bubble."
*Nashville, Phoenix, Dallas, Colorado, Calgary, Winnipeg, Edmonton, and Anaheim look like below-average teams to me, and the only elite teams are Los Angeles and Chicago. I think there are five such teams out East now—Pittsburgh, Montreal, Boston, Ottawa, and Detroit—with only Tampa Bay, Florida, Buffalo, Toronto, and Columbus being solidly below average.
Look, the bottom line is this: the Capitals are not as bad a team as they looked for the first ~15 games last season. Their results won't be as good as they got in the final 20 games of last season, either. But replacing Ribeiro with Grabovski is an upgrade. Getting Erat and Laich for full seasons is an upgrade. Getting an older, more mature John Carlson, Karl Alzner, Braden Holtby, and Marcus Johansson is an upgrade.
The Capitals were an ~even possession team for the last half of the season. Without their 2C (Ribeiro) on the ice, they were basically even as well, and over that final stretch, they were in the black. With Grabovski and Erat in the mix, they should be a positive possession team—or, at least, nonnegative—all the time. Throw in above-average netminding, shot quality/finishing ability (it may not be significant, but it's there), and average special teams (good power play, poor penalty kill), and this is a playoff team.
I don't think Washington is a lock, like Pittsburgh, Detroit, Ottawa, Montreal, and Boston—it's always possible the team hits some major injury issues or really bad luck, or there's some sort of chemistry disaster with Erat and Grabovski trending Nylander, and I don't think their margin of error is big enough to keep them in the playoff picture in those cases—but among the rest of the teams vying for those final three playoff spots, the Capitals, on paper, look as good as anyone. Sure, the "anyone" includes all the bubble teams, but the Capitals were a bubble team in 2012 and 2013, too.
The move to the Metro, at worst, doesn't really change anything.
Charts from above:


Great article. The 'southleast' argument has been abused over the years. Under the old system the Caps only played 8 more games against SE opponents than Atlantic and NE teams... less than 10% of the games.
ReplyDeleteWhile we may have only 2 additional games vs. Metro and they are against Columbus, it also appears we have 11 less games vs. Southeast which should hurt us. It's folly to suggest we haven't benefited from being in the SE where the division winner gets one of the top 3 seeds and home ice to boot. The Caps have been insulated to a certain degree and now we're about to find out if they can achieve results on a level playing field (IMO)
ReplyDeleteI think I covered that point. You replaced Florida, Tampa, and Winnipeg with teams like Dallas, Nashville, Edmonton, Calgary, Phoenix, and Columbus.
ReplyDeleteLook back at that first table: say that opponents of non-WSH SE teams gain 12 more points than opponents of non-Metro teams (per 82 games). The Caps will lose 18 games against the SE on the schedule, compared to 2013 (per 82)--12 more points per 82 times 18 games = 2.6 points, assuming that the rest of the league is about as good as the non-Caps metro. Two or three points can be huge on the playoff bubble, but I think the consensus is that without realignment, the Caps would be comfortably in the playoffs. Losing three points doesn't push a team from "comfortably in" to "out."
It's 82 games. Losing some bad and mediocre teams from 20% of the schedule and instead adding some bad, mediocre, and good teams doesn't change much--the only real difference here is that a handful of easy wins were replaced with a handful of hard wins. (A great team might win three of five games; lottery teams two out of five. Difference = one win = two points.)
Remember, over three-fourths of the schedule hasn't changed at all--it's still four games against each Atlantic team, three games against former NE teams, and at least one game against every team in the West, plus three games against Tampa Bay and Florida, five against Carolina, and a second against Winnipeg.
Put another way, I looked up the winning% of the Caps' schedule the other day. Their new schedule, using the teams' 2013 records, is about 51%. Using their 2012 records, it's 50%. The last two years, the Caps have had schedules in the 49% range. It's not a huge difference--just a win or two per 100 games.
On the playoffs, that's a good point and something that I didn't consider here. I don't think it's a big issue unless the Caps finish in the wild card spot, in which case they either draw a very strong new-Atlantic team like Detroit or Boston, or Pittsburgh.